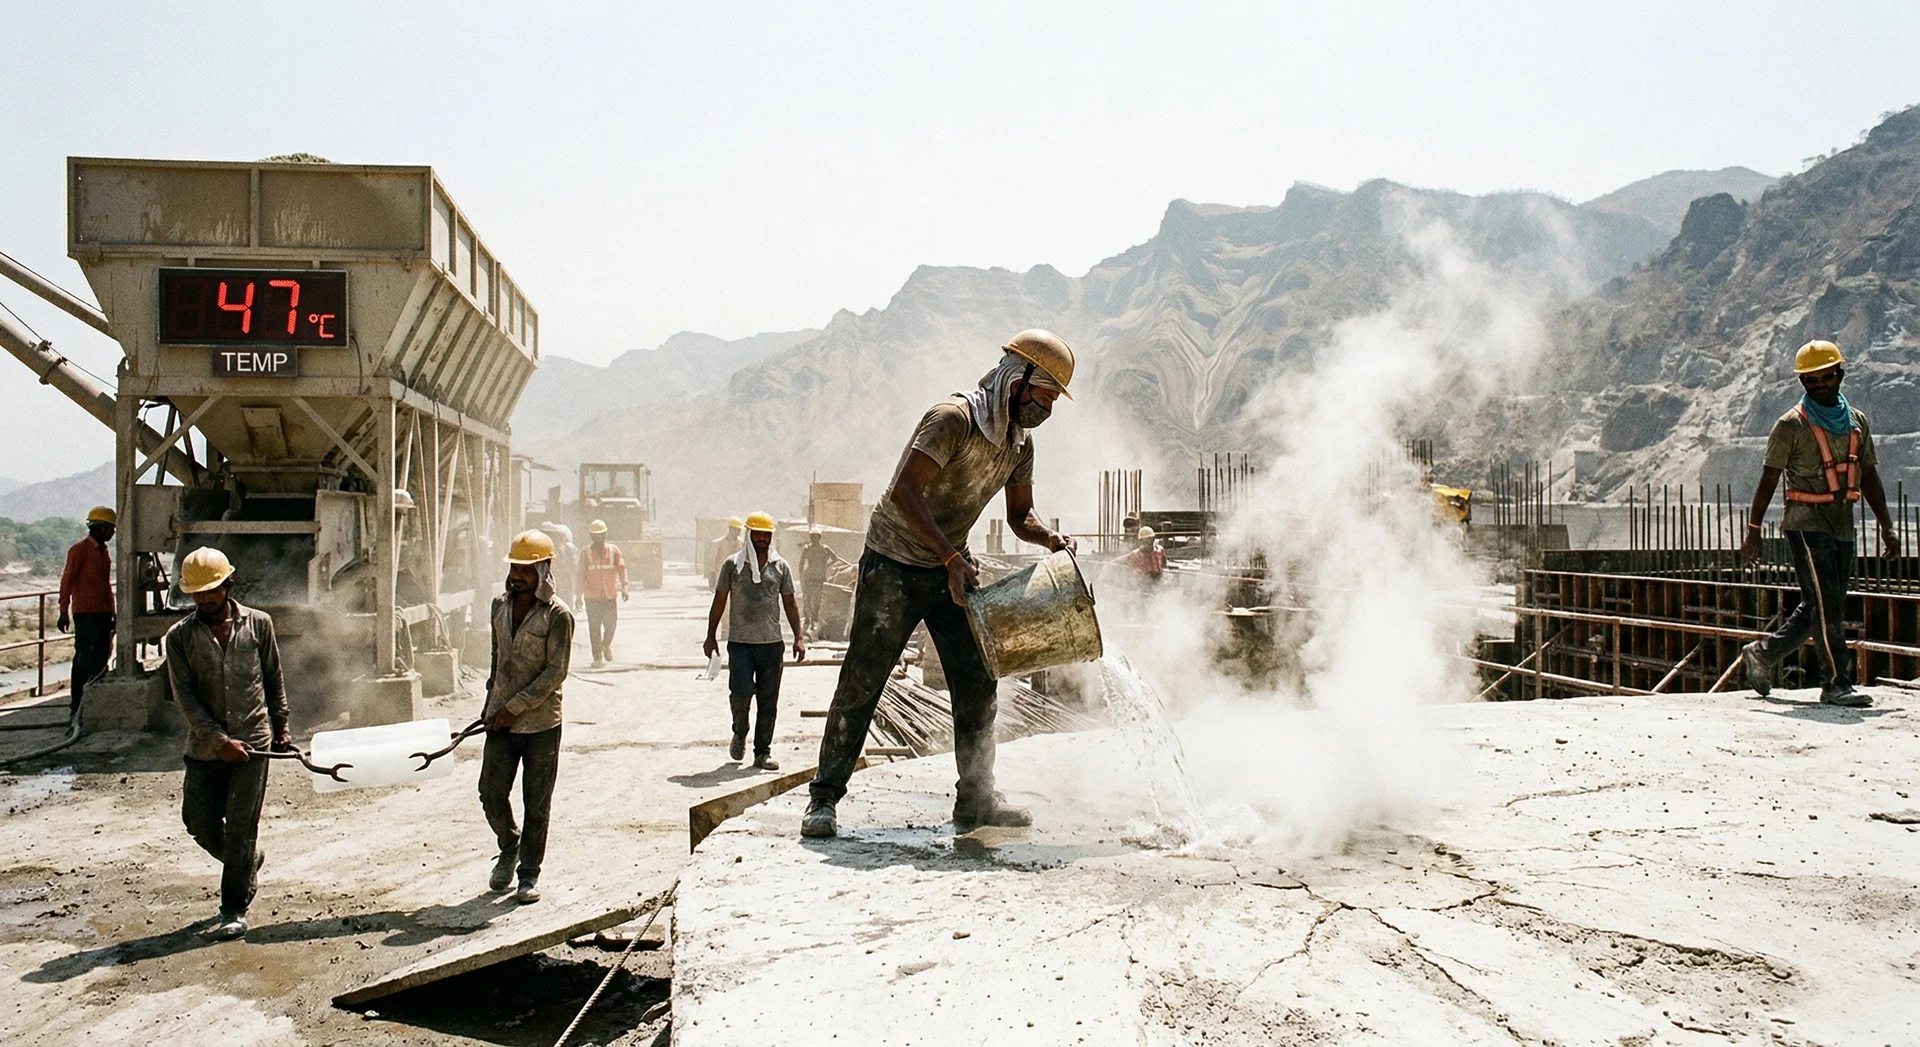
Inside a freshly placed mass concrete lift in a dam, something invisible is happening that will determine whether the concrete cracks or remains intact for the next 100 years.
Cement hydration is generating heat. The temperature is rising. At the surface, heat dissipates to the air. At the centre, it has nowhere to go. The temperature difference between the core and the surface creates a thermal gradient. That gradient creates tensile stress at the surface. If the stress exceeds the young concrete’s tensile capacity, a crack forms.
This entire process, from placement to peak temperature to the onset of cooling and the development of thermal stress, occurs over 3-14 days. It is invisible from the outside. The surface looks fine. The concrete has the correct slump, the correct air content, the correct batch weight. Nothing in the visual appearance or production records indicates a problem.
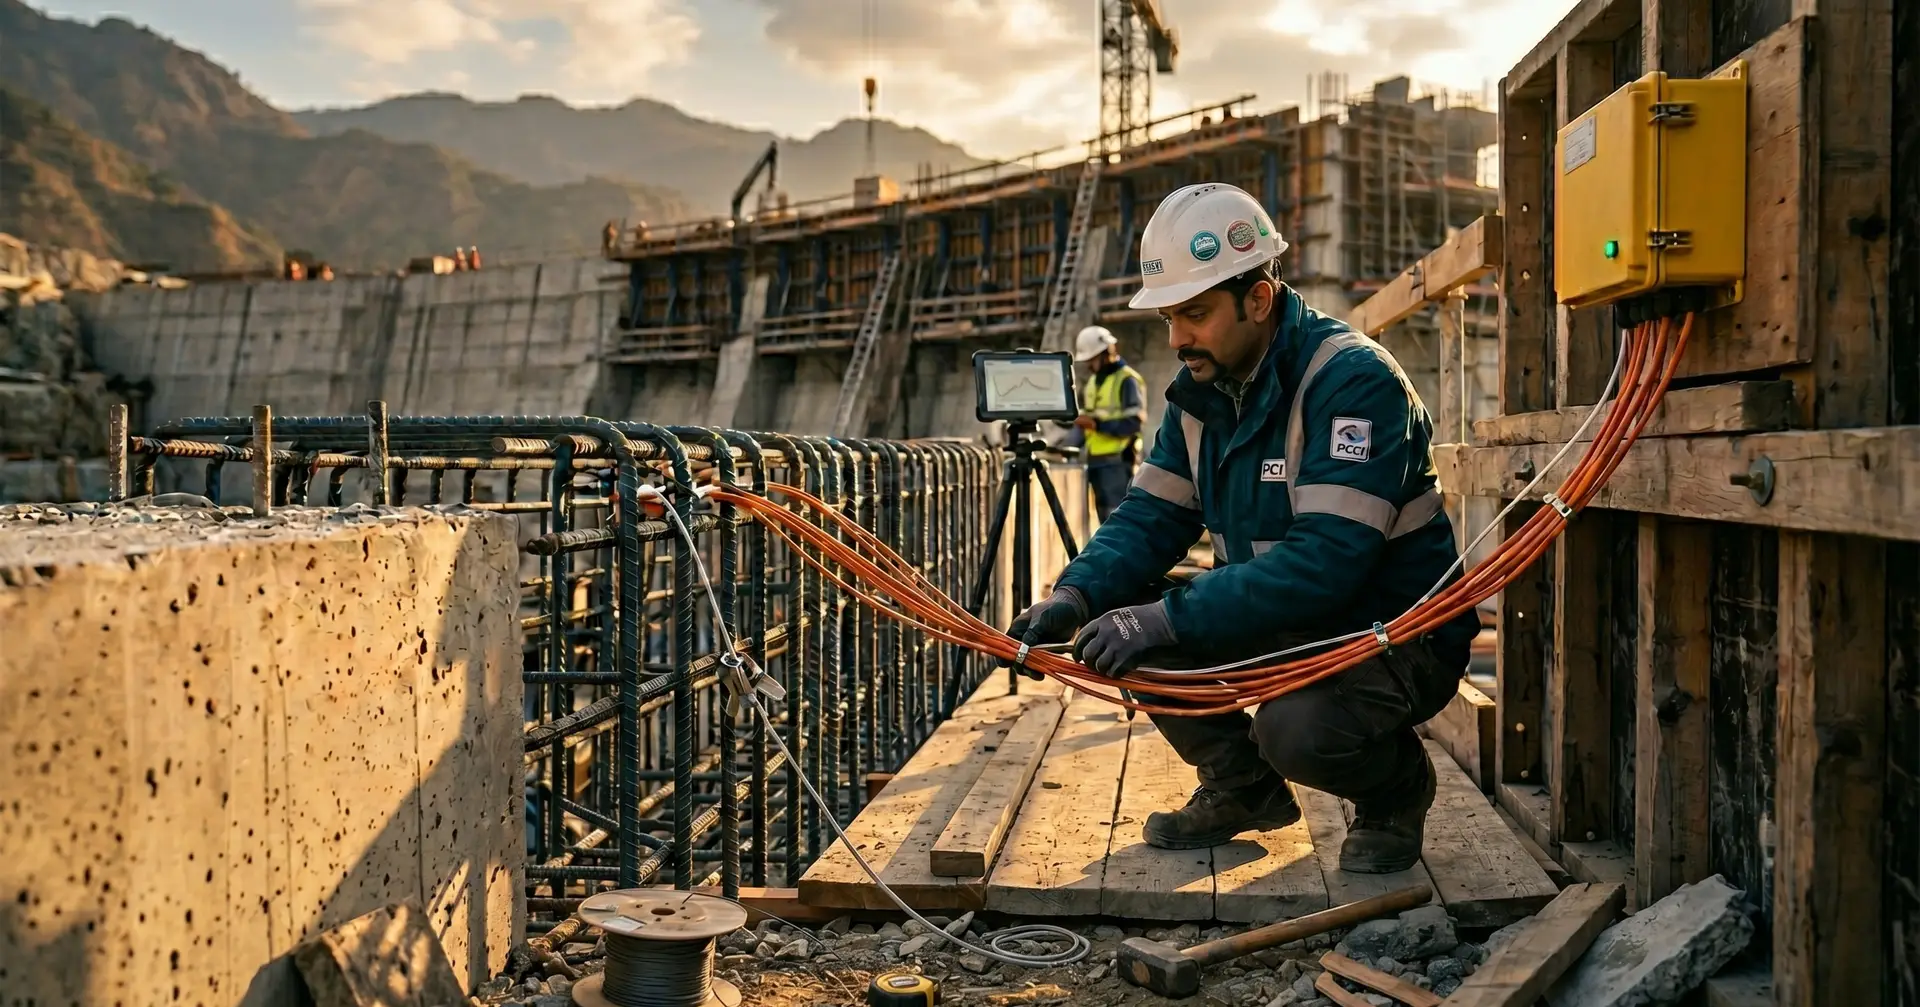
The only way to know what is happening inside the concrete is to measure it. That is the role of thermal instrumentation, the measurement layer that closes the loop on every thermal control plan for a mass concrete dam.
What We Need to Measure
Temperature at Multiple Depths
The thermal gradient between the core and the surface is what drives cracking. Measuring only the surface temperature gives half the picture. Measuring only the core temperature gives the other half. You need both, and the intermediate points, to calculate the actual gradient.
A minimum instrumentation array at a single monitoring location:
- Surface: 50 mm from the exposed face
- Quarter-depth: 25% of the section thickness from the surface
- Mid-depth: 50% of the section thickness
- Core: Centre of the section (location of maximum temperature)
For a 15-metre-wide dam section, this means sensors at approximately 0.05, 3.75, 7.5, and 7.5 metres from the downstream face, with equivalent positions from the upstream face if the thermal regime is not symmetric.
Temperature Over Time
A single temperature reading is a snapshot. The thermal control engineer needs the full time-temperature curve:
- The placing temperature (confirms pre-cooling effectiveness)
- The rate of temperature rise (confirms the adiabatic temperature rise assumptions)
- The peak temperature and when it occurs (confirms thermal model predictions)
- The cooling rate (must be controlled: too-fast cooling increases surface tensile stress, which is why post-cooling pipe systems regulate the gradient over time rather than just the peak)
- The long-term equilibrium temperature (the temperature the concrete will eventually reach, determined by the mean annual ambient temperature)
Temperature Differentials
The critical parameter is not the absolute temperature but the differential: the difference between the hottest point (core) and the coolest point (surface or an adjacent cooled zone). Most specifications, including ACI 207 and the IS 457 family of mass concrete standards, limit this differential to 15-25 degrees C, though the actual safe limit depends on the concrete’s tensile capacity and the degree of restraint.
Sensor Technologies
Thermocouples
Type T (Copper-Constantan) and Type K (Chromel-Alumel) thermocouples are the workhorses of dam thermal instrumentation. They generate a small voltage proportional to the temperature at the measurement junction.
Accuracy: Plus or minus 0.5-1.0 degrees C (adequate for mass concrete monitoring where the critical differentials are 15-25 degrees C)
Advantages:
- Rugged and reliable in the harsh environment inside concrete (vibration, moisture, alkaline pore solution)
- Inexpensive per sensor point
- Long track record in dam construction (decades of proven performance)
- Simple to install: embed the sensor at the desired location and route the lead wires to the data logger
Limitations:
- Point measurement only (each thermocouple measures at one location)
- Lead wires must be routed through the concrete to the data logger, which can be damaged during construction
- Analogue signal is susceptible to electrical noise over long cable runs
Resistance Temperature Detectors (RTDs)
PT100 platinum RTDs measure temperature through the change in electrical resistance of a platinum element.
Accuracy: Plus or minus 0.1 degrees C (higher precision than thermocouples)
Advantages:
- Higher accuracy and stability than thermocouples
- Less susceptible to electrical noise
- Better long-term drift performance (important for monitoring over years)
Limitations:
- More expensive per sensor point than thermocouples
- Slightly more fragile (the thin platinum element is more vulnerable to vibration damage during concrete placement)
- Still a point measurement
Fibre Optic Distributed Temperature Sensing (DTS)
DTS uses a laser pulse sent through a standard optical fibre. As the laser travels, it interacts with the glass molecules, and a small portion of the light is scattered back (Raman scattering). The intensity ratio of the scattered light components is temperature-dependent, allowing the system to measure temperature continuously along the entire fibre length.
Accuracy: Plus or minus 0.5-1.0 degrees C (comparable to thermocouples)
Spatial resolution: Typically 0.5-1.0 metres (the system reports the average temperature over each 0.5-1.0 metre segment of fibre)
Advantages:
- A single fibre provides thousands of measurement points along its length
- Ideal for monitoring temperature distribution across large concrete sections
- No electrical components inside the concrete (immune to lightning, electrical noise, and corrosion)
- One interrogator unit serves multiple fibres across the entire dam
Limitations:
- Higher upfront cost for the interrogator unit (Rs 15-30 lakh)
- The fibre must be carefully installed to avoid breaks (fibre is fragile)
- Spatial resolution (0.5-1.0 m) is coarser than point sensors for localised measurements
- Less proven in Indian dam construction than thermocouples (growing adoption internationally)
Instrumentation Layout Design
Representative Monoliths
Not every monolith needs full instrumentation. The instrumentation plan, guided by ICOLD’s bulletins on dam monitoring, identifies representative monoliths that capture the range of thermal conditions across the dam:
- The thickest section (highest peak temperatures)
- A section near the abutment (highest restraint from rock contact)
- A section in the river channel (different foundation temperature from the abutments)
- A section with galleries or other openings (different thermal boundary conditions)
Vertical Distribution
Within each instrumented monolith, sensors are placed at multiple elevations:
- Near the foundation (where rock contact provides cooling)
- At the thickest section of the dam (mid-height for a gravity dam)
- Near the crest (thinnest section, fastest cooling)
- At any elevation with a change in section geometry (gallery level, spillway notch)
A Typical Layout
For a 60-metre-high gravity dam with 5 instrumented monoliths, each with 4 elevation levels and 4 depth points per level:
5 monoliths × 4 elevations × 4 depths = 80 sensors
Add sensors in the gallery walls, at the abutment contacts, and in the foundation: total approximately 100-150 sensors for a medium dam.
For a large dam (100+ metres): 300-500+ sensors.
Data Acquisition and Real-Time Monitoring
Data Loggers
Automated data loggers read each sensor at programmed intervals (typically every 15-60 minutes) and store the data locally. Modern loggers:
- Accept inputs from thermocouples, RTDs, and other sensor types simultaneously
- Store millions of readings in non-volatile memory
- Communicate via cellular, satellite, or ethernet to a central server
- Operate on solar power in remote locations
Web-Based Dashboards
Real-time temperature data is displayed on dashboards accessible from any device:
- Temperature profiles: Core, quarter-depth, mid-depth, and surface temperatures plotted over time for each instrumented section
- Differential plots: Core-to-surface differential calculated and displayed against the specification limit
- Alarm indicators: Visual and audible alarms when temperatures or differentials approach predefined thresholds
Automated Alerts
The most valuable feature: automated alerts sent via SMS or email when:
- The placing temperature exceeds the specification (pre-cooling system underperforming)
- The temperature rise rate exceeds the model prediction (possible mix issue or ambient condition change)
- The core-to-surface differential exceeds 80% of the specification limit (approaching the cracking threshold)
- A sensor fails (data gap in a critical location)
These alerts enable intervention before a crack forms: adjusting the post-cooling flow rate, applying insulation to the surface, modifying the next lift’s placement schedule, or investigating an anomaly.
Integrating Instrumentation with the Thermal Control Plan
The thermal control plan and the instrumentation plan must be designed together:
- The thermal model predicts the temperature field at each stage of construction
- Sensors are placed at the locations where the model predicts the highest temperatures, the largest gradients, and the greatest cracking risk
- During construction, actual readings are compared with model predictions
- Deviations trigger investigation: if actual temperatures exceed predictions, the cause must be identified (higher-than-expected adiabatic temperature rise, lower-than-expected pre-cooling effectiveness, ambient conditions outside the model assumptions)
- The model is recalibrated based on actual data, improving predictions for subsequent lifts
This feedback loop, from prediction to measurement to adjustment, is what transforms the thermal control plan from a pre-construction document into a real-time construction management tool.
Maturity Monitoring: Strength from Temperature
The same temperature sensors that monitor thermal control also enable maturity-based strength estimation.
The maturity concept: concrete strength development is a function of both time and temperature. Higher temperatures accelerate hydration, producing higher early strength. The maturity function (Nurse-Saul or Arrhenius, codified in ASTM C1074) integrates the measured time-temperature history to calculate a maturity index.
Nurse-Saul maturity: M = Σ (T - T₀) × Δt
Where T is the concrete temperature, T₀ is the datum temperature (typically minus 10 degrees C), and Δt is the time interval.
The maturity index is correlated with compressive strength through laboratory calibration: standard cylinders or cubes from the project mix are cured at different temperatures, tested at various ages, and the strength-maturity relationship is established.
On site, this enables:
- Formwork stripping decisions based on actual in-situ strength rather than elapsed time
- Post-tensioning scheduling for prestressed elements
- Lift joint classification (hot, warm, or cold) based on the maturity of the exposed surface
- Construction loading decisions based on the actual strength of recently placed concrete
Cost and Return
Equipment Cost
For a medium dam (100-150 sensors):
- Thermocouples and lead wire: Rs 1-2 lakh
- Data loggers (4-8 units): Rs 5-15 lakh
- Installation and commissioning: Rs 3-5 lakh
- Software and dashboard: Rs 2-5 lakh
- Total: Rs 12-30 lakh
For a large dam with DTS:
- Fibre optic cable and installation: Rs 5-10 lakh
- DTS interrogator: Rs 15-30 lakh
- Data system: Rs 5-10 lakh
- Total: Rs 30-60 lakh
Return on Investment
Compare these costs to:
- A single thermal crack repair programme: Rs 10-50 lakh per crack
- A thermal cracking investigation (core extraction, FEM analysis, repair design): Rs 25-50 lakh
- A delayed commissioning due to thermal cracking requiring repair: Rs 1-10 crore (depending on project size)
The instrumentation cost is typically less than 0.1% of the total concrete cost. One prevented crack pays for the entire system several times over.
The Future: IoT and Digital Twins
The trajectory of thermal instrumentation is toward fully digital, connected systems:
IoT-Enabled Sensors
Wireless sensors that communicate directly with cloud platforms, eliminating the need for wired data loggers. Each sensor has its own identifier, battery, and transmitter. The data is streamed to a central platform where AI algorithms identify anomalies and predict thermal behaviour.
Digital Twins
A real-time digital twin of the dam is continuously updated with actual sensor data. The thermal model runs in parallel with construction, using measured temperatures as inputs and predicting the thermal stress field at every point in the dam. When the model detects that stress is approaching the tensile capacity, the system alerts the construction team.
Machine Learning
Pattern recognition algorithms, trained on historical thermal data from multiple dam projects, are part of the broader shift toward AI and machine learning in concrete quality control. These algorithms can identify early warning patterns (temperature rise rate anomalies, unusual gradient development) that a human engineer might not detect in the data stream.
These technologies are already in use on major infrastructure projects globally. Their adoption in Indian dam construction is a matter of when, not if. The instrumentation infrastructure being installed today, if designed with digital integration in mind, can serve as the foundation for these advanced systems.
Key Principles
-
Instrument before you pour. Sensors must be installed and verified before concrete placement begins. Retrofitting sensors into hardened concrete is expensive and provides inferior data.
-
Measure what matters. Focus instrumentation on the locations where the thermal model predicts the highest risk: thickest sections, highest restraint zones, and transitions in geometry.
-
Read the data in real time. Data that is downloaded weekly and reviewed monthly is post-mortem data. The value of thermal instrumentation is in real-time intervention.
-
Calibrate the model with measurements. The thermal model is an approximation. Actual measurements improve the model, which improves predictions for subsequent lifts.
-
Archive everything. The thermal record from construction becomes a baseline for the dam’s operational life. Future assessments of thermal cracking risk, durability performance, and structural capacity will reference this data.
Thermal instrumentation is the eyes of the thermal control plan. Without it, you are building a dam with the assumption that everything will go as modelled. With it, you know exactly what is happening inside the concrete, in real time, at every critical location. That knowledge is the difference between a thermal control plan that works on paper and one that works in concrete.