Every cubic metre of concrete placed in a dam carries a carbon cost.
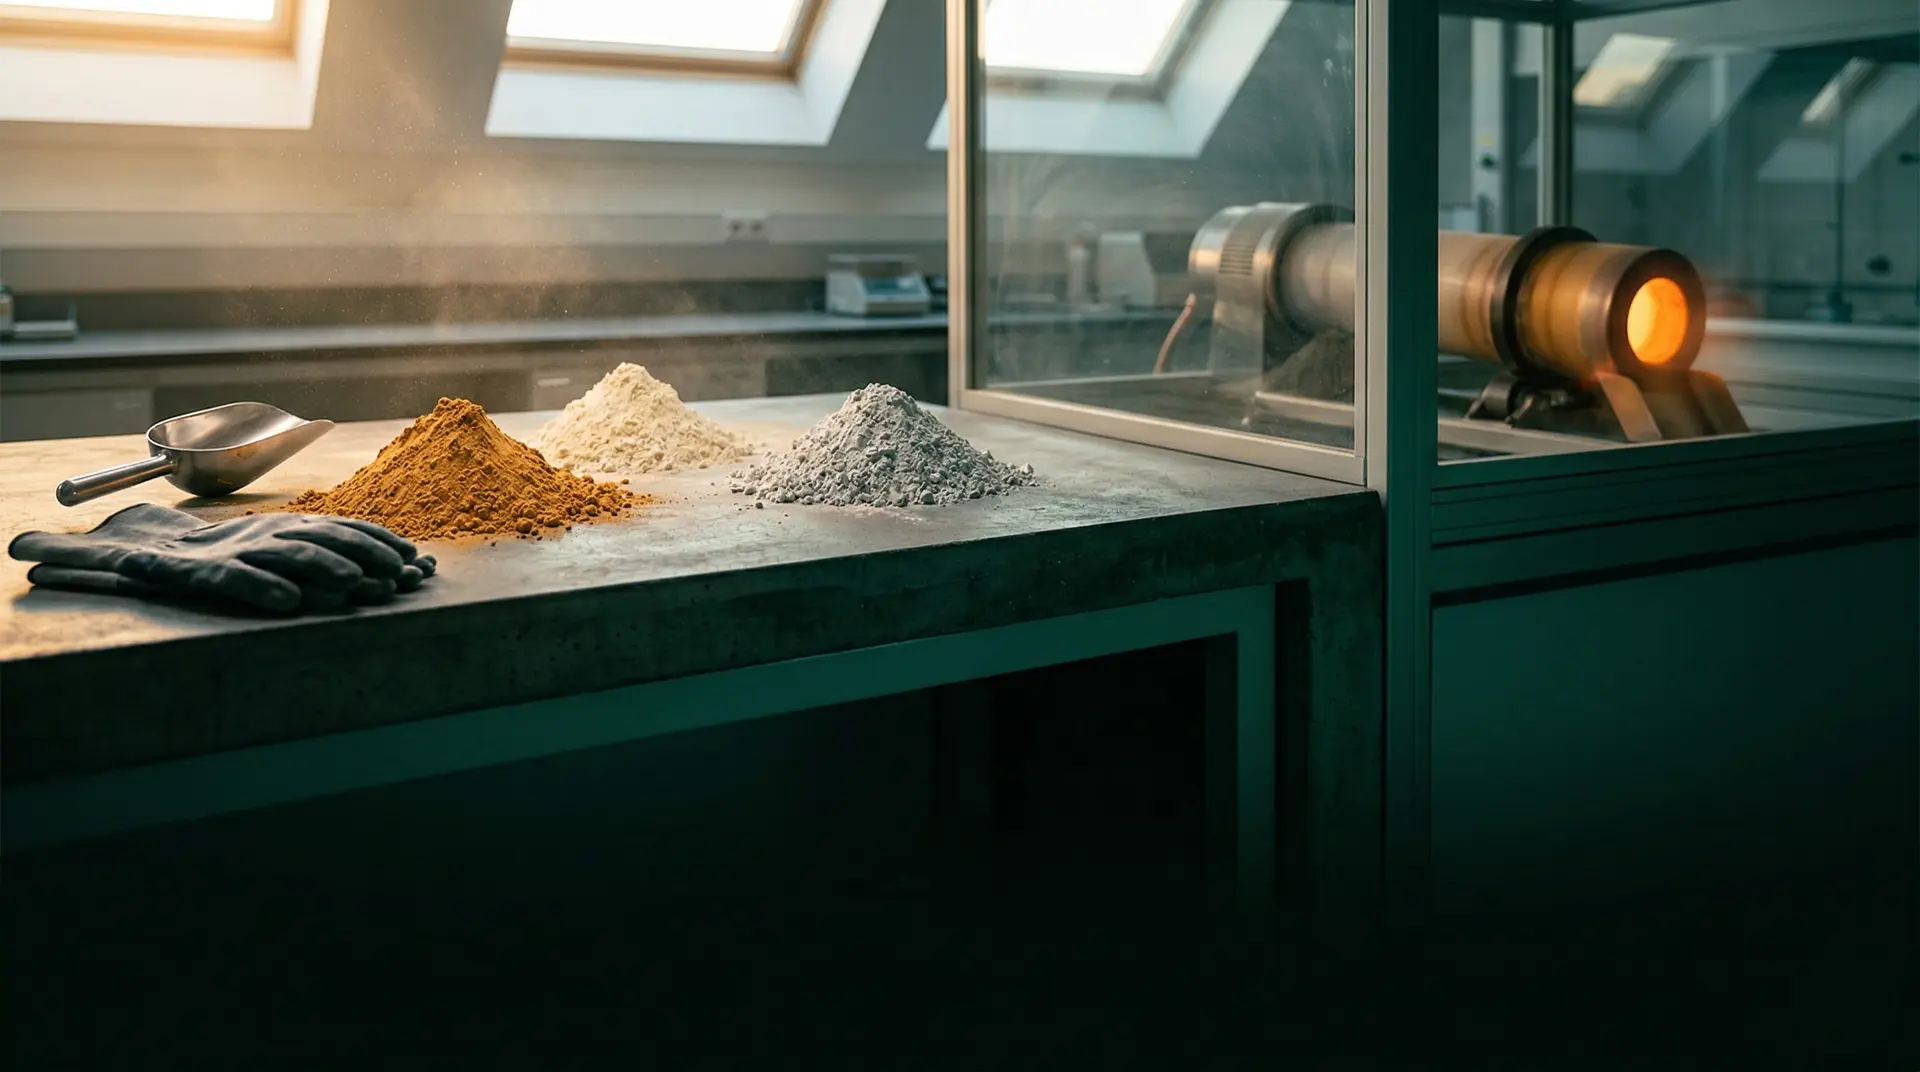
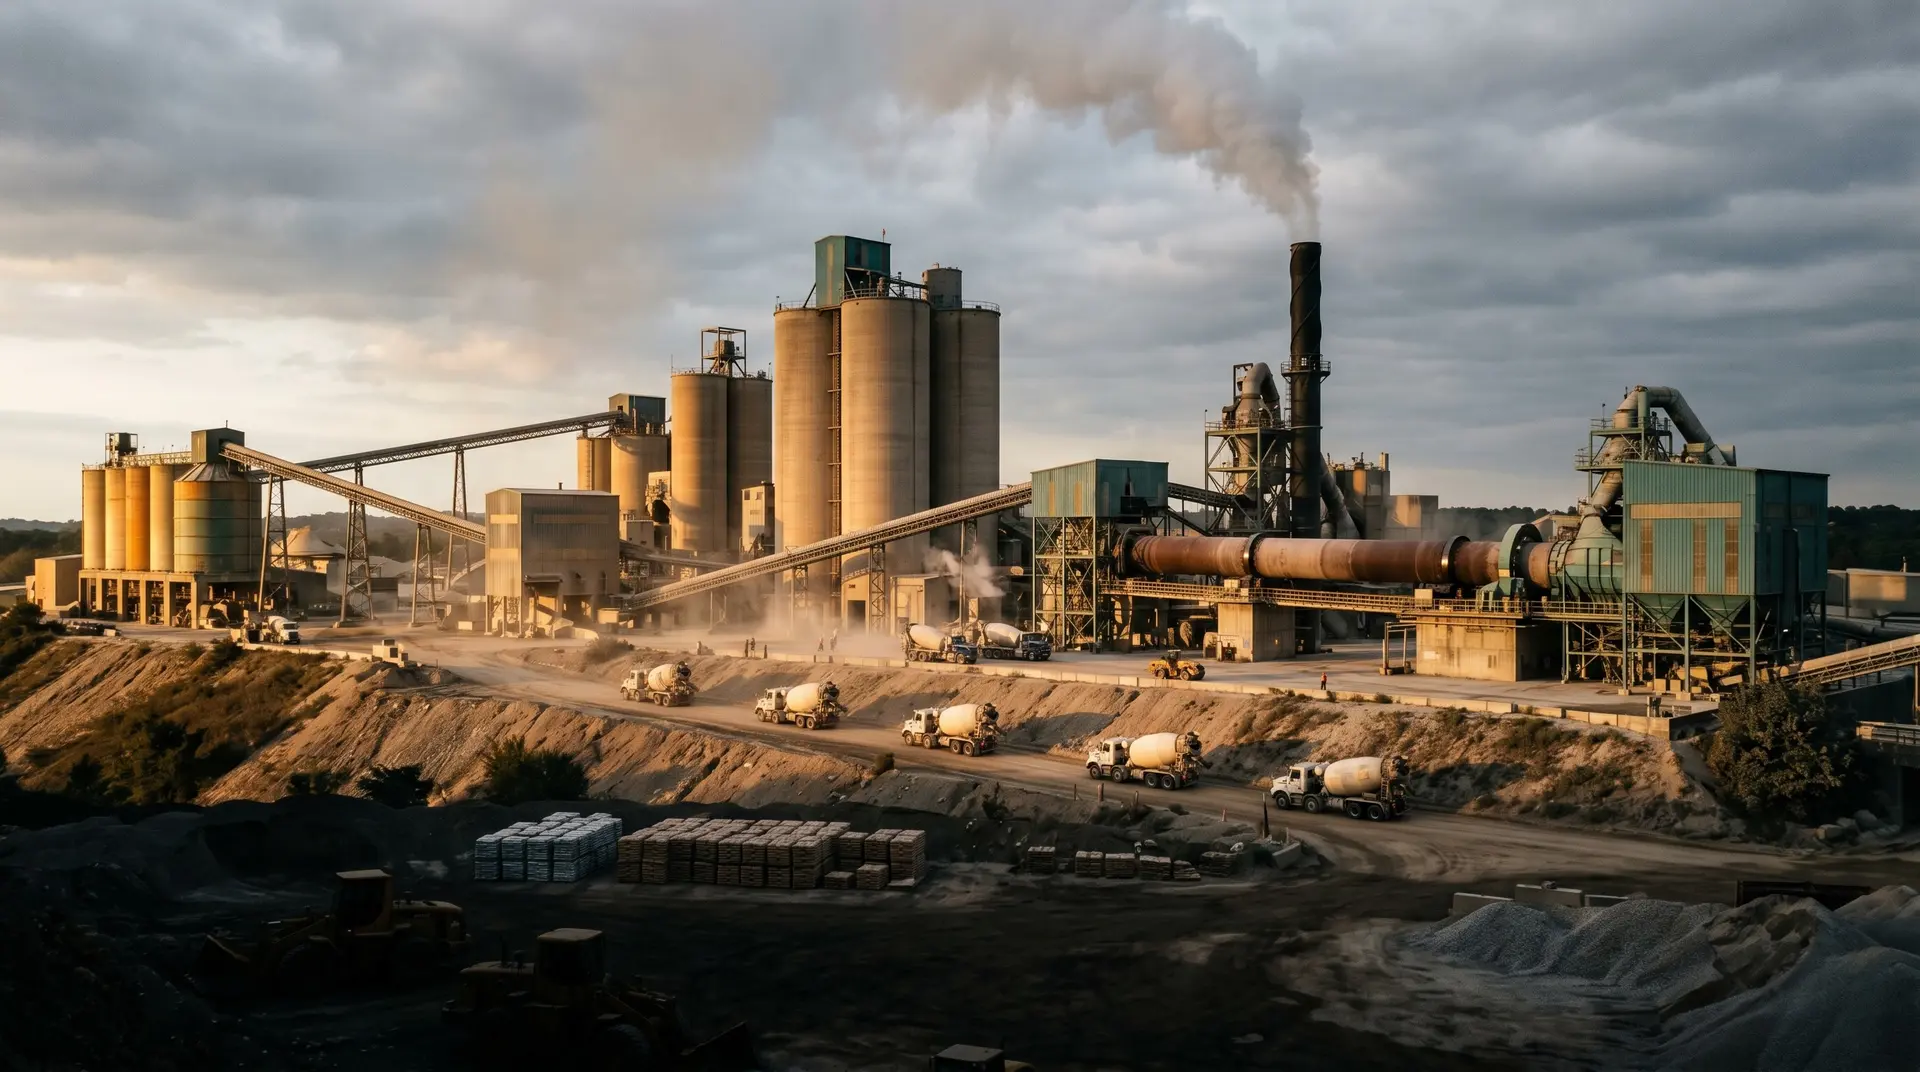
The cost originates primarily at the cement kiln: limestone (CaCO3) is heated to 1,450 degrees C, driving off CO2 in a chemical reaction that accounts for approximately 60% of cement’s carbon footprint. The remaining 40% comes from burning fossil fuels to reach that temperature. The result: approximately 0.8 tonnes of CO2 per tonne of Portland cement clinker.
For a dam requiring 500,000 cubic metres of concrete, the carbon arithmetic is significant. At an average cementitious content of 200 kg/m3 with 40% SCM replacement, the clinker demand is approximately 60,000 tonnes. The CO2 from clinker production alone: approximately 48,000 tonnes. Add aggregate quarrying, transport, batching, placement, and curing, and the total embodied carbon for the concrete scope approaches 50,000-80,000 tonnes of CO2.
That is equivalent to the annual emissions of approximately 10,000-15,000 Indian households.
As multilateral lenders, the World Bank, Asian Development Bank, and AIIB, increasingly require embodied carbon assessments for infrastructure projects, and as India’s climate commitments create regulatory pressure for decarbonisation, dam engineers need to understand where the carbon comes from, how to measure it, and which design decisions reduce it most effectively.
Where the Carbon Comes From
The Carbon Profile of Dam Concrete
For a typical dam concrete mix (200 kg/m3 cementitious content, 35% fly ash replacement):
| Source | CO2 per m3 | Share |
|---|---|---|
| Portland cement clinker (130 kg at 0.8 t CO2/t) | ~104 kg | ~85% |
| Aggregate quarrying and processing | ~5-8 kg | ~5% |
| Transport (cement, aggregate, SCMs) | ~3-7 kg | ~4% |
| Batching, mixing, and placement energy | ~3-5 kg | ~3% |
| Formwork and embedded items | ~2-4 kg | ~3% |
| Total | ~120-130 kg | 100% |
The dominance of clinker is overwhelming: 85% of the carbon comes from one ingredient. This concentration is actually good news for decarbonisation, because it means a single strategy, reducing clinker content, has the greatest impact.
Scaling to Project Level
| Dam Size | Concrete Volume | Approximate CO2 (at 120 kg/m3) |
|---|---|---|
| Small (30m height) | 50,000 m3 | ~6,000 tonnes |
| Medium (60m) | 200,000 m3 | ~24,000 tonnes |
| Large (100m) | 500,000 m3 | ~60,000 tonnes |
| Very large (150m+) | 1,000,000+ m3 | ~120,000+ tonnes |
For India’s pumped storage pipeline of 51 GW across 39 projects, the cumulative concrete demand will be tens of millions of cubic metres. The total embodied carbon from this programme alone could exceed 5-10 million tonnes of CO2. The engineering decisions made at the mix design stage of each project directly determine whether this number is at the high end or the low end of the range.
The Five Levers for Carbon Reduction
Lever 1: Reduce Cement Content Per Cubic Metre
The most direct approach: use less cement.
Mass concrete for dam interiors does not need the same cement content as structural concrete in buildings. The strength requirements are lower (M15-M25 vs. M30-M50), the curing age is longer (90-365 days vs. 28 days), and the primary concern is thermal performance, not early strength.
Practical measures:
- Optimise the mix design to the minimum cementitious content that meets strength and durability requirements
- Use the 90-day or 365-day design age (lower cementitious content can meet strength at later ages)
- Specify performance-based requirements (target strength and durability properties) rather than prescriptive minimum cement content
Potential reduction: 10-20% lower cementitious content, translating to approximately 10-20% lower clinker demand.
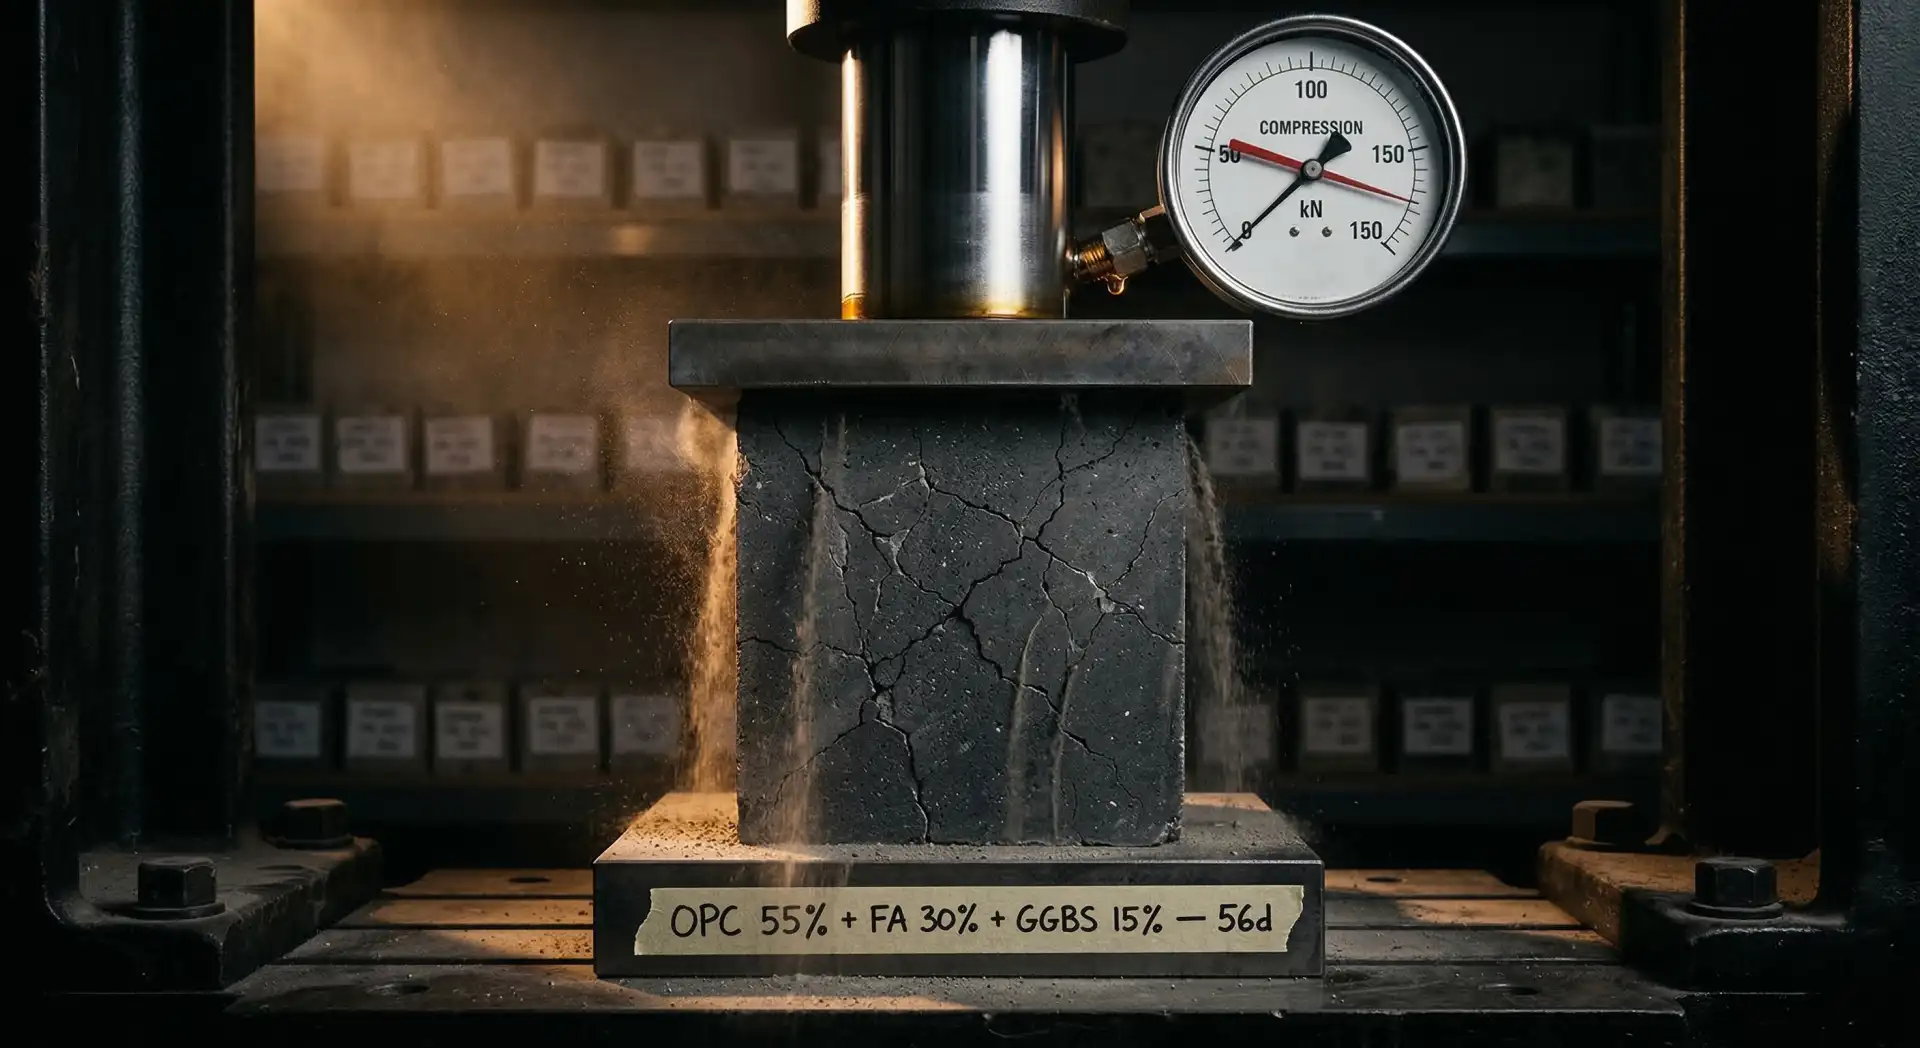
Lever 2: Maximise SCM Replacement
Every kilogram of fly ash, GGBS, or calcined clay that replaces Portland cement clinker eliminates approximately 0.8 kg of CO2.
| SCM Replacement Rate | Clinker Reduction | CO2 Reduction per m3 |
|---|---|---|
| 25% (moderate fly ash) | 25% | ~26 kg |
| 35% (IS 456 limit for fly ash) | 35% | ~36 kg |
| 50% (high fly ash or GGBS) | 50% | ~52 kg |
| 60% (RCC with high fly ash) | 60% | ~62 kg |
For a 500,000 m3 dam, increasing SCM replacement from 35% to 50% saves approximately 8,000 tonnes of CO2.
Practical measures:
- Design for maximum SCM replacement that meets performance requirements at the design age
- Use different SCM strategies for different dam elements (higher replacement in the interior mass, lower in spillway HPC)
- Evaluate calcined clay (LC3) for elements where fly ash supply is uncertain
- Combine SCMs (fly ash + silica fume, fly ash + GGBS) to optimise both carbon and performance
Lever 3: Choose RCC Over CVC Where Appropriate
RCC uses 100-150 kg/m3 of cementitious material versus 200-350 kg/m3 for CVC. This alone reduces CO2 by 30-50% per cubic metre.
Additionally:
- RCC typically does not require embedded cooling pipes (saving steel production emissions)
- RCC requires less formwork (saving timber or steel)
- RCC placement is more energy-efficient per cubic metre (no crane and bucket operations)
For a 500,000 m3 dam, using RCC instead of CVC can save 20,000-40,000 tonnes of CO2.
Lever 4: Optimise Transport and Logistics
Transport emissions are a smaller share (3-7% of total), but they scale with distance and can be reduced through:
- Local aggregate sourcing: Every kilometre of haul distance adds CO2. Prioritise aggregate sources within 10-20 km of the dam site.
- SCM sourcing strategy: Fly ash from a nearby power plant has lower transport emissions than GGBS from a distant steel plant. Include transport emissions in the SCM selection decision.
- Efficient batching: Minimise idle running of batching equipment. Optimise batch sizes to reduce the number of transit mixer trips.
- Conveyor vs. truck transport: For large projects, conveyor delivery from batching plant to placement face is more energy-efficient than truck haul.
Lever 5: Design Optimisation
The most powerful lever, because it multiplies all the others.
Dam geometry: A 10% reduction in total concrete volume through optimised dam cross-section design saves 10% of the carbon across all categories. Modern finite element analysis, guided by ICOLD design bulletins, can optimise the dam section to the minimum concrete volume that meets stability, strength, and seepage requirements.
Durability = carbon reduction: Concrete that does not need to be repaired saves the carbon of the repair concrete. The article “The Greenest Concrete Is the One You Don’t Have to Repair” captures this principle: investing in durability (proper SCM strategy, adequate cover, air entrainment, quality construction) avoids the double carbon cost of replacement concrete.
Design life extension: A dam designed for 150 years instead of 100 years avoids the need for a replacement structure within the current planning horizon. The marginal cost of additional durability measures is far less than the carbon cost of building a new dam.
Measuring Embodied Carbon
The Calculation Framework
Embodied carbon assessment follows the lifecycle assessment (LCA) framework, typically covering:
A1-A3 (Product stage): Raw material extraction, transport to manufacturer, and manufacturing. For concrete, this is primarily clinker production plus aggregate quarrying.
A4 (Transport): Delivery of materials to the dam site.
A5 (Construction): On-site batching, mixing, transport, placement, compaction, and curing.
For dam concrete, stages A1-A3 dominate (85-90% of total). A complete LCA also considers B1-B7 (use stage, including maintenance and repair) and C1-C4 (end-of-life), but these are less significant for long-life infrastructure designed for 100+ years.
Data Sources
Cement: Environmental Product Declarations (EPDs) from the cement manufacturer provide the specific CO2 per tonne for each cement type. Where EPDs are unavailable, the GCCA global average of 0.83 tonnes CO2 per tonne of clinker is commonly used.
SCMs: Fly ash is typically allocated zero or minimal embodied carbon (it is an industrial waste product). GGBS is allocated a small share of the blast furnace emissions (typically 0.05-0.15 t CO2/t). Calcined clay has a carbon footprint of approximately 0.2-0.3 t CO2/t (the calcination energy).
Aggregates: Typically 3-10 kg CO2 per tonne depending on quarrying method, processing, and transport distance.
Reporting
The GCCA EPD tool and the One Click LCA platform are the most widely used tools for concrete carbon calculation. For dam projects funded by multilateral lenders, the carbon assessment is typically included in the Environmental and Social Impact Assessment (ESIA).
The Economic Driver
Carbon is not only an environmental metric. It is increasingly an economic one:
Carbon pricing: India does not yet have a carbon tax on cement, but the European Union’s Carbon Border Adjustment Mechanism (CBAM) and similar mechanisms in other jurisdictions signal the direction. When carbon is priced at $20-50/tonne CO2 (the range of current and proposed mechanisms), a 500,000 m3 dam’s concrete carbon footprint of 60,000 tonnes represents an economic exposure of Rs 10-25 crore.
Green bonds: Projects funded through green sovereign bonds or green financing facilities must demonstrate environmental performance. Lower embodied carbon strengthens the green credential and can improve financing terms.
Bid evaluation: Increasingly, tender evaluations for publicly funded infrastructure include environmental criteria. A bid that demonstrates lower embodied carbon through optimised mix design and SCM strategy scores higher than a generic specification.
A Carbon Reduction Roadmap for Dam Projects
Pre-Tender Stage
- Include embodied carbon targets in the project specification
- Specify performance-based concrete requirements (strength at 90/365 days, durability properties) rather than prescriptive minimum cement content
- Require the contractor to submit an embodied carbon assessment with their concrete specification
Design Stage
- Optimise dam geometry to minimise concrete volume
- Design for maximum practical SCM replacement rates, differentiated by dam element
- Evaluate RCC for the dam body where site conditions permit
- Specify locally available SCMs to minimise transport emissions
Construction Stage
- Monitor actual cementitious content and SCM replacement rates against the design targets through rigorous QA/QC systems
- Track embodied carbon as a project KPI alongside cost, schedule, and quality
- Document the carbon reduction achieved for reporting to lenders and regulators
Commissioning
- Report the final embodied carbon assessment as part of the project completion documentation
- Benchmark against similar projects and publish the results to build industry knowledge
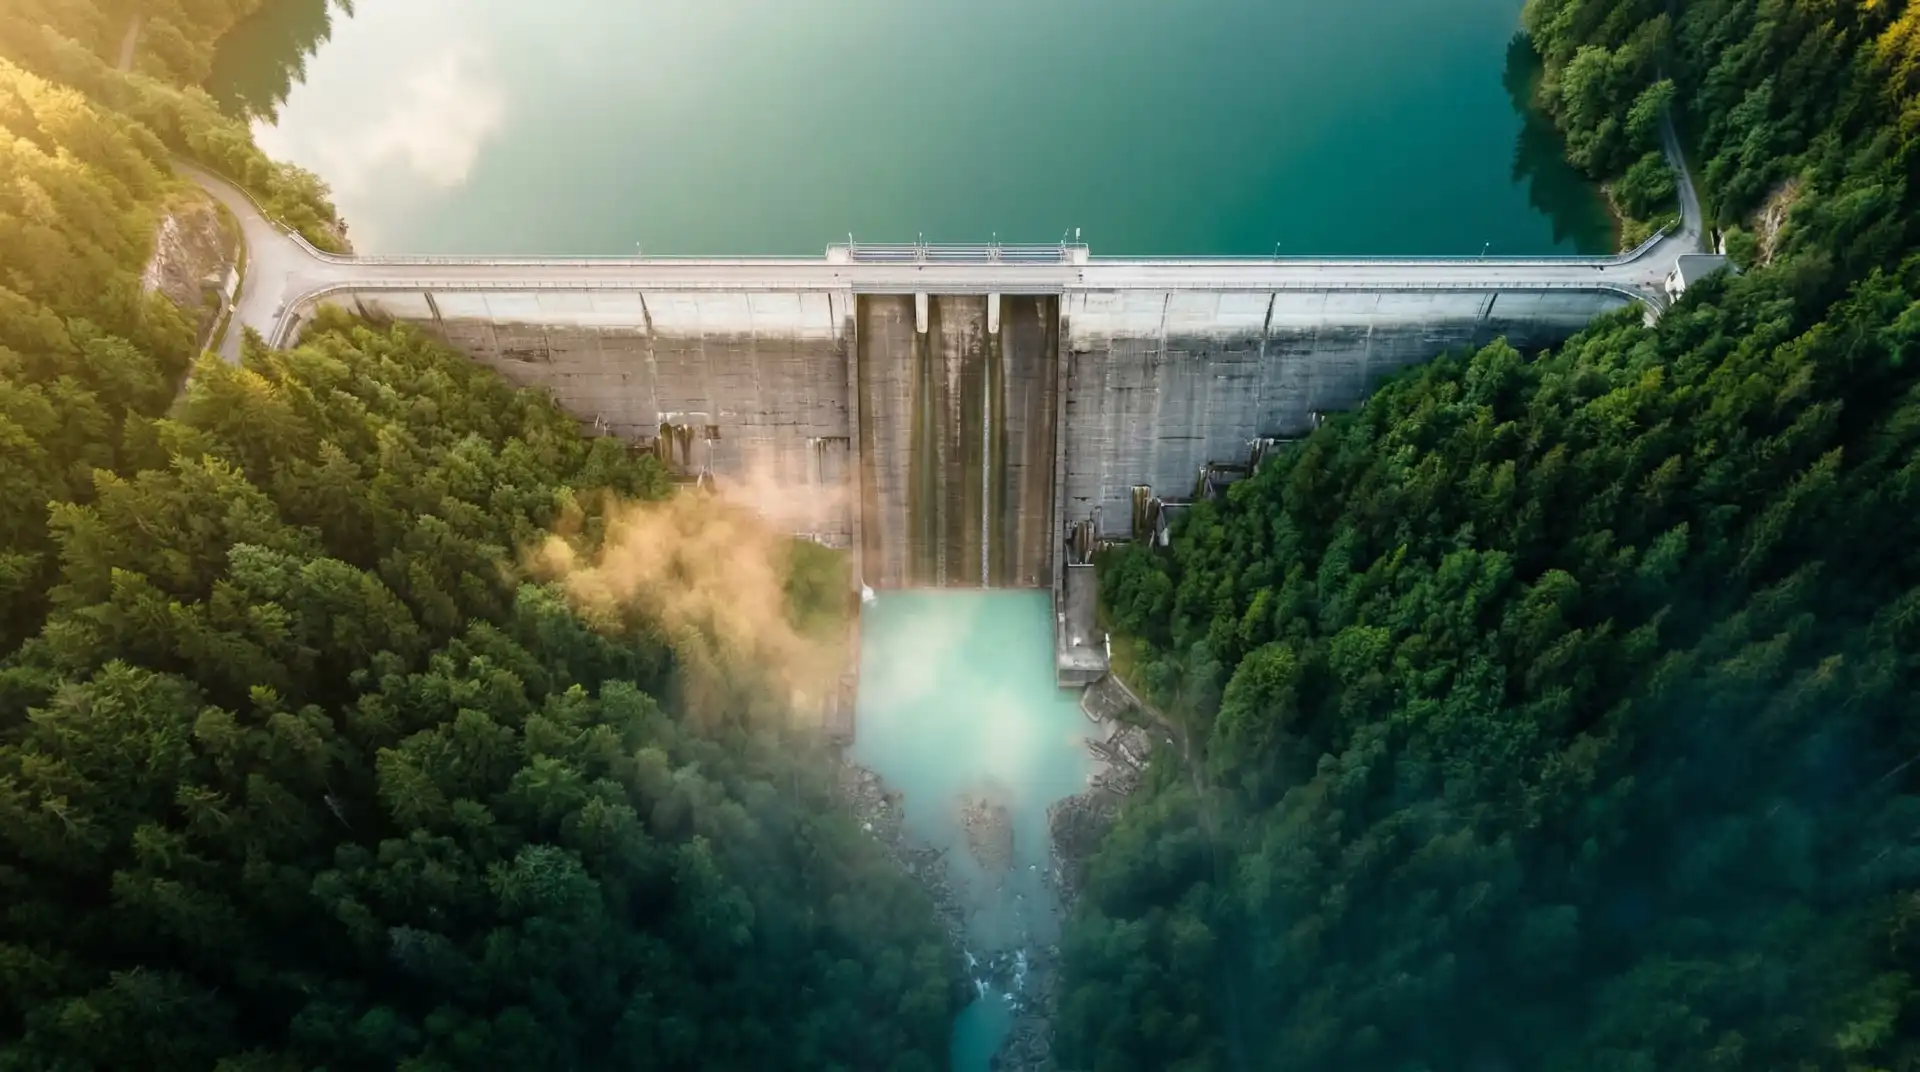
The Paradox of Hydropower Carbon
There is an irony in discussing the carbon footprint of dam concrete: hydropower is one of the lowest-carbon electricity sources available. A hydroelectric dam produces emissions during construction (embodied carbon in concrete, steel, and equipment) but generates zero-carbon electricity for 50-100+ years of operation.
The lifecycle carbon intensity of hydropower is typically 4-30 grams of CO2 per kilowatt-hour, compared to 400-1,000 g/kWh for fossil fuel generation. A large hydropower project’s construction carbon is typically “paid back” through avoided fossil fuel emissions within 1-3 years of operation.
Reducing the embodied carbon of dam concrete accelerates this payback period and strengthens hydropower’s position as a clean energy source. For pumped storage projects that enable the integration of intermittent renewable energy, the carbon payback is even faster because every kilowatt-hour stored and dispatched replaces a kilowatt-hour that would otherwise come from a gas or coal peaker plant.
The greenest concrete for a dam is not zero concrete. It is the minimum concrete, with the minimum clinker, that meets the performance requirements for 100+ years. Every tonne of clinker saved in the dam’s construction multiplies through decades of clean energy generation.