Every hydropower dam programme runs two parallel quality systems on the same concrete. The contractor’s QA/QC team certifies what was placed. The Owner’s Engineer verifies, on the owner’s behalf, that what was placed is what was specified. Both teams are competent. Both follow IS, ACI, and ASTM. Both produce paperwork. Yet on every major dam programme, certain defect patterns slip through contractor QC and are caught only by the Owner’s Engineer.
These are not failures of competence. They are failures of perspective. The contractor’s QC team optimises for schedule, throughput, and the next pour. The Owner’s Engineer optimises for the structure’s 100-year service life, against a specification the owner paid for and a code the regulator will audit against. The two perspectives produce different attention patterns. The Owner’s Engineer catches what the contractor’s QC, under schedule pressure, often treats as within tolerance.
This is the field-tested list of 12 such defects, drawn from leadership experience across more than 4,000 MW of hydroelectric concrete placement in India, Bhutan, and Nepal. Each defect comes with the field signal that reveals it, the specification clause it violates, the structural consequence if uncaught, and the Owner’s Engineer process that catches it before the pour cures.
1. Cement alkali content drift between supply batches
Field signal. The cement test certificate for two consecutive supply lots shows total alkali content (Na₂O equivalent, calculated as Na₂O + 0.658 K₂O) varying by more than 0.10 percentage points. One lot reports 0.55 percent. The next reads 0.66 percent. Both are within the supplier’s general specification. Neither is in itself a rejection.
Why contractor QC often misses it. The contractor’s lab logs each test certificate and confirms the alkali content is below the project specification’s upper limit. If the spec allows up to 0.60 percent and one lot is at 0.66 percent, the lot may be rejected. If the spec allows 0.80 percent (common in many older Indian specifications), both lots pass. The lab does not flag the variation as a pattern.
Why this matters. Cement alkali content above 0.60 percent Na₂O equivalent is the long-recognised threshold for alkali-silica reaction (ASR) risk on potentially reactive aggregates (USBR DSO-03-05; FHWA Alkali-Aggregate Reactivity Facts Book). In a dam body that will be wet for 100 years, AAR can express itself decades later as expansion, cracking, and structural distress. A peer-reviewed study on Norway’s Votna I dam documented free alkali metal leaching and ASR-related distress in a structure where the cement alkali was, batch by batch, individually acceptable but collectively drifted upward over the construction period (Determining the free alkali metal content in concrete: case study of an ASR-affected dam). The variability between batches matters as much as any single value.
How the Owner’s Engineer catches it. Two practices. First, the Owner’s Engineer maintains a running alkali-content chart by supply date and lot number, not just by test certificate. A drifting trend is visible even when each individual test is in spec. Second, the Owner’s Engineer cross-checks the cement test certificate against an independent split-sample test from a third-party lab at least once per supply contract. Suppliers occasionally report alkali by acid-soluble method when the spec calls for water-soluble, which silently shifts the reported value downward. Catching this requires reading the test method on the certificate, not just the number.
Standards reference. IS 12269 (53-grade ordinary Portland cement) and IS 8112 (43-grade) govern Indian cement supply. IS 12330 specifies sulphate-resisting Portland cement. ASTM C150 covers US-equivalent specifications. None of these standards by themselves enforces alkali variability tracking; the project specification must do so, and the Owner’s Engineer must police it.
2. Aggregate gradation creep on the conveyor
Field signal. Crushed-aggregate gradation at the batching plant’s stockpile feed shows the fine fraction (passing 4.75 mm sieve) creeping upward week by week. The contractor’s QC sieve analysis still reports each test within the IS 383 envelope, but the percentage passing the lowest sieve has risen from 8 percent to 14 percent over four weeks. The mid-fraction has correspondingly fallen.
Why contractor QC often misses it. Each sieve test is logged individually and compared against the IS 383 specification envelope. Each one passes. The drift across weeks is visible only if someone is plotting the trend, which most contractor QC labs do not do for routine gradation tests. The drift originates not in the crusher but in the conveyor. Belt vibration causes the fines to settle to the belt bottom, and when material discharges to the stockpile or front-end loader bucket, the segregation is visible only if you watch the discharge stream carefully (AASHTO Resource: Concrete Aggregate Testing).
Why this matters. A mass concrete mix designed for a specific gradation will, with a 5 to 6 percentage-point upward creep in the finest fraction, demand more water at the batching plant for the same target slump. The batch plant operator, often without a single conversation with the QC engineer, increases water dose to maintain workability. The water-to-cement ratio creeps up. Twenty-eight-day strength holds, but durability indicators (permeability, sorptivity, chloride diffusion) degrade quietly. On a dam with a 100-year design life, the consequence is shortened service life on the elements where this concrete was placed.
How the Owner’s Engineer catches it. A weekly trend chart of every gradation test, not just per-test compliance review. The Owner’s Engineer also walks the conveyor and observes the discharge stream during routine site visits. A discharge stream with visible bands of fines or coarses is segregating; a uniform stream is not. This is a five-minute observation that the contractor’s QC engineer, sitting at the plant control room, does not see.
Standards reference. IS 383:2016 specifies coarse and fine aggregate gradation envelopes. ACI 207.1R covers mass-concrete aggregate gradation guidance, including the recommendation that no single gradation curve should drift consistently within the spec envelope without investigation. ASTM C33 governs US-equivalent practice.
3. Fly-ash variability between supply lots
Field signal. The fly-ash test certificate from the source thermal power station shows the silicon dioxide content varying from 56 percent to 64 percent across consecutive supply lots. Loss on ignition (LOI) varies between 1.2 and 3.4 percent. Both lots are within the IS 3812 Class F or Class C envelope, and both meet ASTM C618 (PMC: Hydration Characteristics of Low-Heat Cement Substituted by Fly Ash and Limestone Powder). The fly-ash percentage in the mix design has not changed. The contractor’s mass-concrete mix continues to be batched at the same 30 percent cement replacement.
Why contractor QC often misses it. Each lot’s test certificate is individually compliant. The contractor’s QC engineer files it. The mix design is not adjusted because no single lot triggers a rejection. The variation between lots is not on anyone’s daily checklist.
Why this matters. Heat of hydration in mass concrete is a function not just of cement content but of the specific reactivity of the supplementary cementitious materials. A Class F fly ash at 56 percent SiO₂ has a different early-age reactivity than the same nominal Class F at 64 percent SiO₂. The peak temperature in a 4-metre-thick dam lift can vary by 4 to 6°C between lots, even when the mix design is identical. The thermal control plan, calibrated against an assumed adiabatic temperature rise from initial trial mixes, can be silently invalidated by a fly-ash lot change (ACI 207.1R-21 preview, Mass Concrete Guide).
How the Owner’s Engineer catches it. The Owner’s Engineer requires a calorimetry test (heat of hydration by isothermal or semi-adiabatic calorimetry) on the cement-fly-ash combination at the start of each supply contract, and re-tests when the fly-ash source changes or after a long shutdown. The result is matched against the thermal control plan’s input assumptions. If the peak temperature rise has drifted by more than 2°C against the design assumption, the placement temperature window is tightened to compensate.
Standards reference. IS 3812 (Part 1) covers Indian pulverised fuel ash for cement and concrete. ASTM C618 is the US equivalent. ACI 207.2R-07 (now superseded; see current revision) governs thermal and volume change effects on mass concrete cracking.
4. Placement temperature exceeding the thermal control plan
Field signal. A summer afternoon pour at a hydropower dam site. The batching plant is producing concrete at 32°C. The transport truck arrives at the dam face with the mix at 34°C. Pre-cooling by chilled water and ice flake replacement was specified in the thermal control plan to deliver concrete at the dam face at a maximum of 18°C. The contractor’s placement supervisor logs the temperature as 28°C in the daily pour register.
Why contractor QC often misses it. The supervisor either takes the temperature reading at the batching plant (before transport-heat gain) and not at the dam face, or uses a hand-held probe that reads air-pocket temperatures rather than the concrete bulk. The reading is technically within the spec if measured at the wrong location. The contractor’s QC system does not require a calibrated cross-check.
Why this matters. Mass concrete placed above its specified thermal control plan temperature will reach a higher peak temperature during curing. ACI 207.2R recommends keeping the temperature differential between the core and surface of a mass concrete element below 19.4°C (35°F) during curing to prevent thermal cracking. ACI 207.1R-21 also references the Performance-Based Temperature Difference Limit approach, which evaluates the allowable differential based on tensile strain capacity and restraint rather than a fixed value. Either way, the placement temperature is the primary input. A 10°C miss on placement temperature can translate to a 5 to 8°C overshoot at the core, with the consequent thermal crack pattern emerging in the first week and persisting for the life of the structure. ACI 301 also limits maximum internal mass concrete temperature to 70°C (158°F) to avoid delayed ettringite formation (DEF) risk.
How the Owner’s Engineer catches it. Independent temperature measurement at the dam face, using a calibrated probe, at every placement. Cross-check against the contractor’s log. Trend chart by hour of day. The Owner’s Engineer also reviews the pre-cooling system capacity, the ice production rate, and the chilled-water flow rate to verify the plant can in fact deliver the specified placement temperature under the day’s ambient conditions. If the plant cannot, the placement should be rescheduled to a cooler period of the day, regardless of schedule pressure.
Standards reference. ACI 207.1R, ACI 207.2R, ACI 207.4R, and the project-specific thermal control plan. IS 14591 covers temperature control of mass concrete for dams (Guidelines), authored by PCCI’s Managing Director. ACI 305.1 and ACI 305R cover hot-weather concreting more generally, with ACI 305.1-14 setting 35°C (95°F) as the maximum at discharge for general hot-weather concrete, which is a less stringent limit than the mass concrete placement temperatures specified in dam thermal control plans.
5. Bedding mortar or GERCC gaps at RCC lift joints
Field signal. A roller-compacted concrete dam has just placed a lift over an underlying lift that has been exposed for 14 hours under afternoon sun. The contractor’s QC report records that bedding mortar was applied to the lift surface before the new RCC was spread. The Owner’s Engineer’s walk reveals that the bedding mortar coverage shows visible gaps near the upstream face, where the spreading was rushed to keep up with the RCC paver.
Why contractor QC often misses it. The QC engineer signs off on the bedding mortar application from the central control booth, based on the mortar batch volume produced and the surface area to be covered. The arithmetic confirms coverage. What the arithmetic does not detect is the lateral non-uniformity. Application near the contraction joints and the upstream face is often rushed because the paver is waiting.
Why this matters. Lift joints are the weakest plane in an RCC dam. In-situ tests across multiple international projects have measured joint tensile and shear strength at 30 to 80 percent of the parent RCC (Penn State CE 584 Lift Joints reference; Water Power Magazine: Grout enriched RCC: a history and future). Seepage through lift joints is the dominant failure mode in RCC dams. A gap in bedding mortar at the upstream face creates a direct seepage path that will not show during the first reservoir filling but will emerge over years. The use of grout-enriched RCC (GERCC) at faces achieves better continuity by adding cement-sand grout to the uncompacted RCC and vibrating the two materials together, producing a paste-rich transition zone that improves bond and watertightness.
How the Owner’s Engineer catches it. Physical inspection of every lift surface before the next placement, including the upstream and downstream face zones. Independent measurement of bedding mortar thickness at multiple points using a depth probe. Verification that GERCC mix is being dosed at the face zones according to the project specification. The Owner’s Engineer also checks the modified maturity factor (M = Σ T·Δt) of the underlying lift to classify it as hot, warm, or cold joint per USACE EM 1110-2-2006, Roller-Compacted Concrete. Hot joints (low maturity, recent placement) need minimal treatment; warm joints need bedding mortar; cold joints (high maturity, prolonged exposure) need aggressive surface treatment plus bedding or GERCC.
Standards reference. USACE EM 1110-2-2006. ACI 207.5R Roller-Compacted Mass Concrete. ICOLD Bulletin 177 on RCC dams.
6. Cooling pipe spacing deviation during embedment
Field signal. A mass concrete lift has been placed with embedded cooling pipes on a 1.0 metre x 1.0 metre grid as specified in the thermal control plan. The Owner’s Engineer’s pre-pour walk finds, in a 4 metre by 6 metre patch near a contraction joint, that two adjacent cooling pipes have been tied at 1.4 metre centres because of an obstruction with an embedded instrument cable. The contractor’s QC engineer has logged the obstruction but allowed the placement to proceed.
Why contractor QC often misses it. The pipe spacing is verified against the layout drawing on the morning of placement. After that, the engineer is at the batch plant or the placement face. Once the pipes are embedded in concrete, the deviation cannot be visually verified after the pour. The QC engineer relies on the pre-placement check.
Why this matters. ACI 207.4R recommends pipe vertical spacing equal to the lift height and horizontal spacing equal to vertical spacing for the most uniform cooling pattern. A localised increase in spacing from 1.0 metre to 1.4 metres reduces the cooling capacity in that zone by approximately 40 percent (cooling capacity scales with surface area to volume ratio of the pipe network within the concrete). The result is a localised hot spot during peak hydration. Peer-reviewed research on post-cooling system design has shown that pipe spacing has a substantial effect on thermal stress, with stress concentrations developing where spacing deviates from design (Giatec: ACI 207 Performance-Based Temperature Difference Limit and Maturity Method). The thermal crack risk in that zone increases sharply.
How the Owner’s Engineer catches it. A pre-placement walk of the lift, with a tape measure, to verify pipe spacing at random sample points. The walk should specifically focus on zones around contraction joints, embedded instrumentation, and form penetrations, where spacing deviations are most likely. The Owner’s Engineer also requires that any spacing deviation greater than 10 percent of the design spacing be redesigned (either by adding a supplementary pipe loop or by accepting the local hot spot in the thermal model with a documented sign-off).
Standards reference. ACI 207.4R, Cooling and Insulating Systems for Mass Concrete. USBR Concrete Manual chapters on cooling systems. The project-specific thermal control plan.
7. Premature formwork stripping based on age alone
Field signal. A vertical formwork panel on a powerhouse concrete pour is stripped at 18 hours after placement, based on the contractor’s chronological-age criterion (24 hours is the contractual minimum; the contractor argues that warm weather will compensate). The Owner’s Engineer notes that overnight temperatures dropped to 12°C, and the maturity index for the pour is well below the equivalent of 24 hours at standard 20°C cure.
Why contractor QC often misses it. The contractor’s QC procedure tracks elapsed time from placement, not maturity. The maturity method (per ASTM C1074) requires temperature loggers, a datum temperature (typically 0°C or -10°C using the Nurse-Saul function), and a strength-maturity curve calibrated for the specific mix. Most contractor QC labs do not maintain this discipline.
Why this matters. Concrete strength gain is governed by maturity, not by elapsed time. A pour at an average overnight temperature of 12°C will reach a fraction of the strength of the same pour cured at 20°C over the same 18 hours. ASTM C1074 explicitly supports the use of maturity to determine when formwork stripping, post-tensioning, or load application is appropriate. Premature stripping causes early-age cracking, surface spalling at the formwork interface, and in extreme cases structural deflection. On a hydropower powerhouse or intake structure, an early-age crack pattern propagated through the heat of hydration phase becomes a permanent feature of the structure.
How the Owner’s Engineer catches it. Requires the contractor to install temperature loggers in the pour and calculate the modified maturity factor (M = Σ T·Δt) before any stripping. The Owner’s Engineer reviews the maturity log and the strength-maturity curve for the mix. Approves stripping only when the maturity index demonstrates the in-place concrete has reached the specified stripping strength (typically 70 percent of the 28-day characteristic strength for vertical formwork on dams). Contractor argues delay; Owner’s Engineer holds the line; the project owner backs the Owner’s Engineer because the cost of a single structural crack is greater than the cost of a 12-hour delay.
Standards reference. ASTM C1074, Standard Practice for Estimating Concrete Strength by the Maturity Method. IS 456 Section 11.3 covers formwork removal time. ACI 301 specifies removal-strength criteria.
8. Cold joint formation during plant breakdowns or shift changes
Field signal. A mass concrete lift placement on a dam buttress is interrupted at 1740 hours when the batching plant’s primary mixer reports a gearbox alarm. The shift was scheduled to end at 1800. The standby mixer is brought online at 1815. Placement resumes at 1845. The exposed surface of the placed concrete has been sitting at ambient temperature for 65 minutes. The contractor’s placement engineer records the resumption time and continues the pour.
Why contractor QC often misses it. The contractor’s QC system records the interruption as a “delay” and notes that placement resumed. There is no explicit procedure to classify the resulting interface as a cold joint, hot joint, or construction joint, because the contract specification does not contemplate unplanned interruptions. The placement engineer makes a field judgment, which is usually that the surface is still workable and no joint treatment is required.
Why this matters. A cold joint forms when concrete already in place begins to set before the next layer is placed on it. Typical initial set times for mass concrete are 4 to 8 hours, but at 30°C ambient with no fly-ash retardation, initial set can be much sooner. A 65-minute interruption in 30°C ambient air can cause the top centimetre of the placed concrete to develop early hydration product, breaking the monolithic placement. Cold joints negate the monolithic structural behaviour the design assumes, create higher porosity in the interface zone, weakened shear and tensile strength, and decreased durability (USBR DSO-03-05, Effects of Concrete Deterioration on Safety of Dams; Structuremag: Cold and Hot Weather Concrete).
How the Owner’s Engineer catches it. A pre-placement protocol that addresses the cold joint scenario explicitly. If a placement is interrupted for more than 30 minutes, the Owner’s Engineer requires the contractor to assess the exposed surface against initial set criteria. If initial set has begun, the joint is treated as a construction joint and requires green cutting, scrubbing, and bedding mortar application before placement resumes. The Owner’s Engineer also reviews the contractor’s plant redundancy and shift-change protocols to verify that breakdowns and end-of-shift transitions are not a recurring cold joint risk.
Standards reference. Constrofacilitator: Cold Joint in Concrete: Causes & Prevention. ACI 207.1R. ACI 207.2R. Project-specific construction joint specification.
9. Reinforcement cover encroachment in congested sections
Field signal. A reinforced concrete section at a spillway pier shows two layers of #32 bars on 150 mm centres in both directions, with embedded thermocouple instrumentation tied at the inner layer. The specified cover is 75 mm. A pre-pour inspection finds, at three locations near a bend in the bar pattern, that the outermost bar is only 45 mm from the form face. The contractor’s QC engineer accepts the deviation as a local detail.
Why contractor QC often misses it. Cover measurement at the inspection stage is sampled. If the QC engineer measures at 20 random points and finds 18 within tolerance and 2 marginal, the section is signed off. The 2 marginal points are typically in congested zones where the bars have been pulled inward to make space for instrumentation, embedded items, or to clear other bars.
Why this matters. Concrete cover is the primary line of defence for reinforcement durability. ACI 318 Section 20.6 governs cover requirements; IS 456 Table 16 sets corresponding values for Indian construction. For a dam exposed to a moist hydropower environment, cover reduction from 75 mm to 45 mm shifts the carbonation depth time-to-reinforcement by roughly the square of the cover ratio, which means a 40 percent reduction in cover translates to approximately a 65 percent reduction in time-to-corrosion-initiation. For a 100-year service life design, the affected zone may begin corrosion within 30 to 40 years, which is decades earlier than the design intent (ACI 318-19, Building Code Requirements for Structural Concrete).
How the Owner’s Engineer catches it. A pre-pour cover survey using a calibrated cover meter (ferroscan or eddy-current type) at every congested zone and bar bend, not just at sampled grid points. The Owner’s Engineer also reviews the rebar shop drawings against the embedded items drawings to identify zones where conflict is likely. Any cover reduction below the specified minimum requires either rebar relocation, a documented alternative durability provision (such as epoxy coating or supplementary cover plate), or a sign-off by the project structural engineer acknowledging the reduced service-life implications.
Standards reference. ACI 318-19, Building Code Requirements for Structural Concrete, Section 20.6. IS 456:2000, Table 16. fib Bulletin 34 for service-life design including cover provisions.
10. Curing water chemistry variance
Field signal. The dam construction site uses a local stream for curing water. The contractor’s QC tests at project mobilisation showed the water meets IS 456 requirements. Six months into construction, monsoon runoff has changed the upstream catchment composition. A spot-check by the Owner’s Engineer finds the curing water chloride content has risen from 180 ppm to 720 ppm. The contractor’s QC programme has not retested the water source since the original certification.
Why contractor QC often misses it. Curing water is treated as a one-time certification at project start. The mixing water for concrete is tested more frequently. Curing water, applied to hardened concrete surfaces, is often assumed to be a maintenance activity not subject to ongoing testing.
Why this matters. Curing water that is chemically aggressive can introduce chlorides, sulphates, or organic acids into the concrete surface during the most permeable phase of the structure’s life. Standards for mixing water apply at least directionally to curing water as well. ASTM C1602 sets optional chemical limits for combined mixing water: chloride (Cl⁻) at 500 ppm for prestressed and bridge-deck concrete, 1000 ppm for other reinforced concrete in moist environments; sulphate (SO₄) at 3000 ppm; alkalies (Na₂Oeq) at 600 ppm; total solids at 50,000 ppm (ASTM C1602/C1602M-22). IS 456:2000 limits mixing water suspended particles to 2000 mg per litre and prescribes pH and chemical content limits. High chlorides accelerate reinforcement corrosion, depress freezing point of pore solution (a concern in cold-climate dams), and produce visible surface efflorescence and staining.
How the Owner’s Engineer catches it. Quarterly retesting of all water sources used on site, including curing water. Trend chart of chemical content over time, especially across monsoon and dry season cycles. If the water source is surface water, retesting is required immediately after any visible runoff event or change in source.
Standards reference. ASTM C1602, Standard Specification for Mixing Water Used in the Production of Hydraulic Cement Concrete. IS 456:2000 clause 5.4. ACI 301 water-quality provisions.
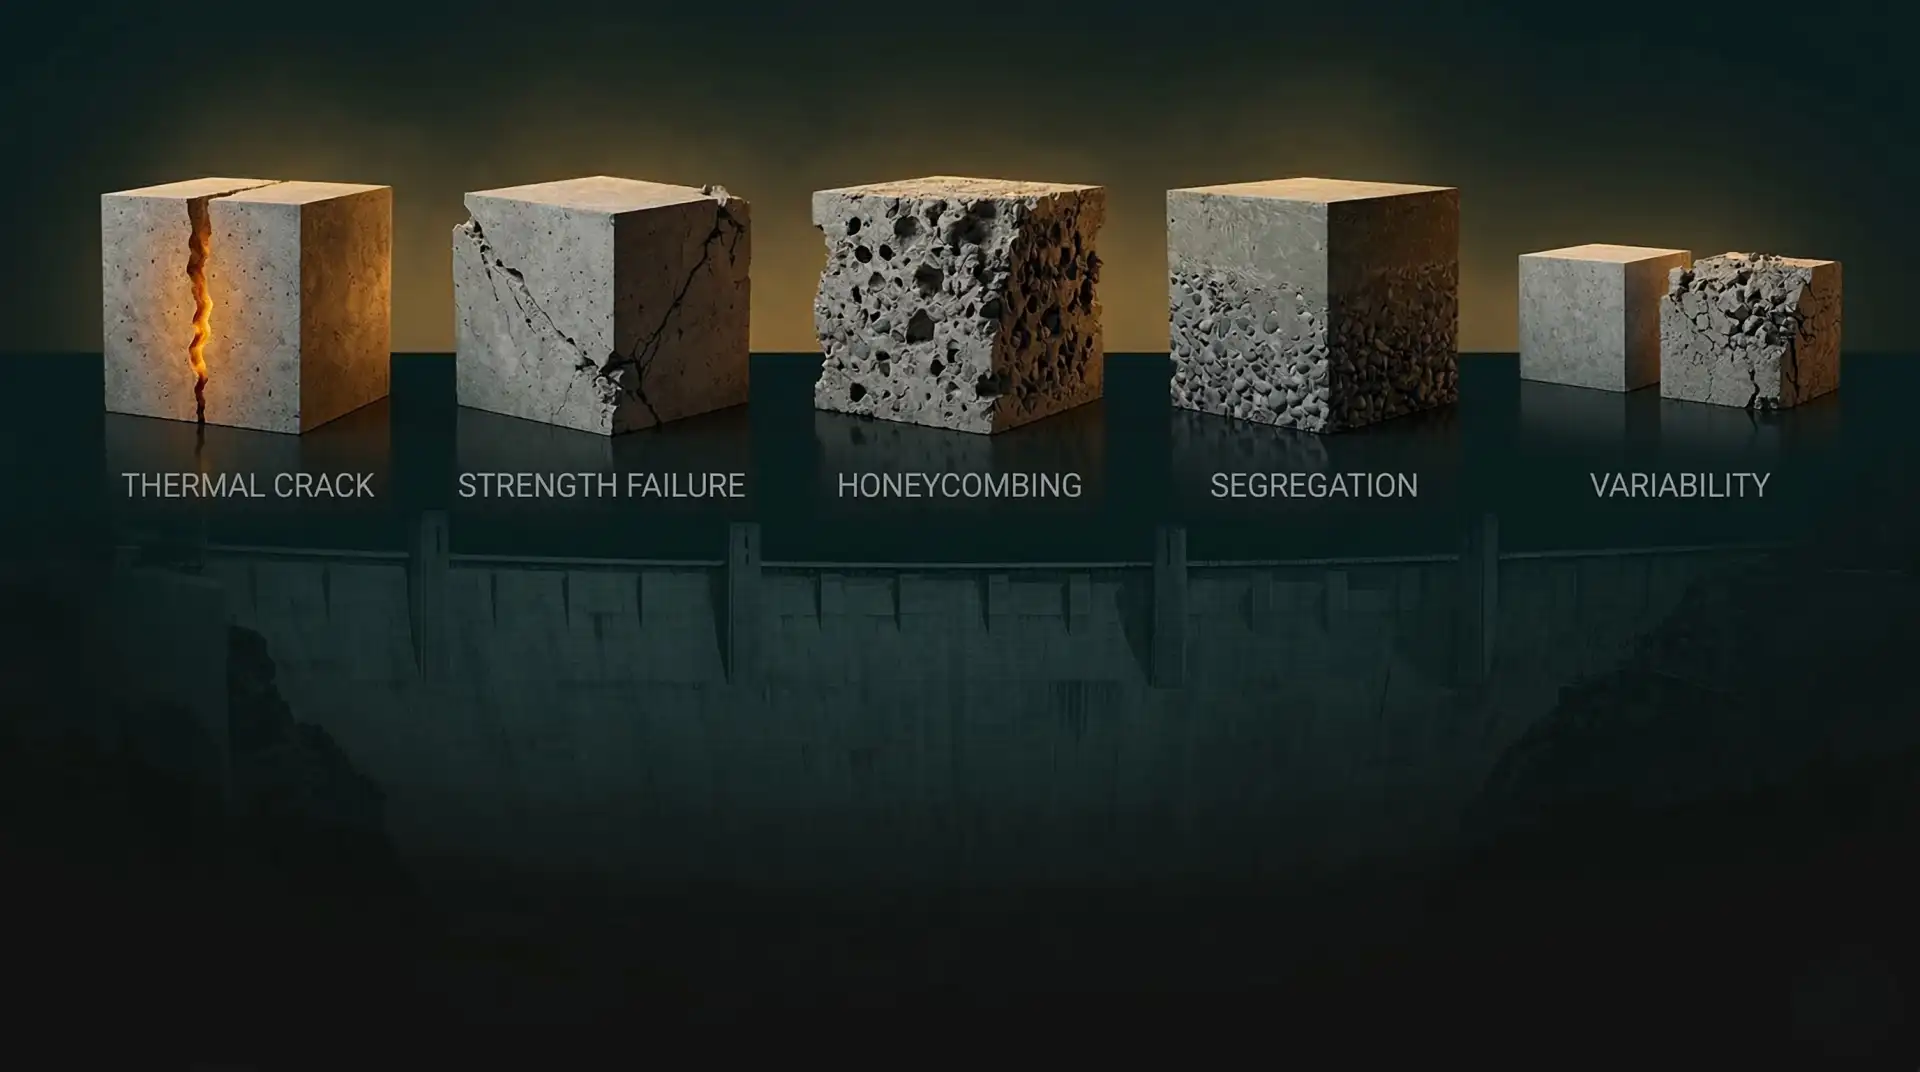
11. Honeycombing and segregation at form corners and lift faces
Field signal. A vertical concrete pour at a dam intake structure shows, after form stripping, visible honeycombing pockets at the bottom corners of the form, in a strip of about 200 mm height. The exposed coarse aggregate is loose and the cement paste fill is incomplete. The contractor’s QC engineer notes the defect but classifies it as cosmetic and proposes surface patching with non-shrink grout.
Why contractor QC often misses it. The QC engineer sees the defect after form stripping. The defect’s depth into the structural section is not determined. The most common decision is to apply a surface repair on the visible face, without investigating whether the void extends into the structural concrete.
Why this matters. Honeycombing is created when cement paste fails to fill the voids between coarse aggregate, leaving zones of zero tensile strength, high permeability, and accelerated deterioration. The most common causes in mass-concrete dam pours are inadequate vibration near the form (where the vibrator did not reach close enough to the formwork), failure of the vibrator to penetrate into the previous lift at the interface, and segregation during placement. At the lift joint interface, inadequate vibration is also a direct cold-joint risk. A 200 mm strip of honeycombing on a vertical face may extend only 30 to 40 mm into the section, in which case surface patching is appropriate. It may extend 200 to 400 mm into the section, in which case structural repair (epoxy injection, full-depth replacement, or anchor pinning) is required.
How the Owner’s Engineer catches it. Non-destructive testing on every honeycombing area before any patching. Ultrasonic pulse velocity (UPV) tests, impact-echo, or core drilling at sampled points to determine the void depth. The repair specification is then matched to the actual depth: cosmetic for shallow, structural for deep. PCCI’s troubleshooting consulting supports the depth-classification and root-cause analysis stages of this process. The Owner’s Engineer also reviews the contractor’s vibration plan to identify recurring honeycombing patterns and addresses the root cause: vibrator type, vibrator spacing, vibration duration, operator training, or formwork detail.
Standards reference. ACI 309R, Guide for Consolidation of Concrete. ACI 207.1R. IS 456. BFS Industries: The Critical Threat of Cold Joints in Concrete Columns.
12. Cube cure-tank temperature variance
Field signal. Routine 28-day cube strengths from a dam pour are reporting consistently 5 percent below the design strength target. The contractor’s QC engineer notes the variance but accepts the cubes because individual cubes are within the IS 456 acceptance criteria. The Owner’s Engineer suspects a systemic test issue and checks the cube cure tank. The thermometer reads 24°C. The standard is 27°C ± 2°C.
Why contractor QC often misses it. The cure-tank temperature is typically read once per week, often without calibration of the thermometer. The QC engineer has no incentive to question a result that is technically within the per-cube acceptance window. The systemic 5 percent strength loss across the entire batch is attributed to “field conditions” or “trial mix margin” rather than a tank temperature drift.
Why this matters. IS 516 specifies cube curing at 27°C ± 2°C. ASTM C31 specifies similar laboratory cure conditions at 23 ± 2°C for standard-cured specimens. A 3°C deviation below 27°C reduces 28-day strength by approximately 5 to 8 percent for typical OPC and PPC mixes, because hydration kinetics are temperature-sensitive. If the entire batch of acceptance test data is biased low by 5 percent, the contractor either rejects compliant concrete (costly), or accepts non-compliant concrete because the bias hides it (catastrophic). Either way, the acceptance decisions are made against test data that does not represent the actual concrete quality.
How the Owner’s Engineer catches it. Independent calibration of the cure tank thermometer at the start of construction and at quarterly intervals using a traceable reference thermometer. Verification that the tank has adequate water circulation and that all cubes are fully submerged. Split-sample testing of a fraction of acceptance cubes at an external accredited laboratory to cross-check the on-site lab’s results. If the cross-check shows systematic bias, the on-site lab procedures and equipment are audited.
Standards reference. IS 516 (Part 1):2021, Method of Tests for Strength of Concrete. ASTM C31, Standard Practice for Making and Curing Concrete Test Specimens in the Field. ASTM C39, Standard Test Method for Compressive Strength. ASTM C511, Standard Specification for Mixing Rooms, Moist Cabinets, Moist Rooms, and Water Storage Tanks.
What separates the Owner’s Engineer from contractor QC
Reading this list, a contractor’s QC engineer may protest that all 12 defects are within scope of any competent contractor QA/QC programme. They are. The question is not whether the procedures exist on paper. The question is whether they survive the daily pressure of an active dam construction site.
Contractor QC reports to the contractor’s project manager. The project manager’s compensation, bonus, and career are measured against schedule and budget. When a QC engineer holds up a placement to investigate a 4°C placement temperature overshoot, that delay shows up on the manager’s variance report. The manager has a structural incentive to find the engineer’s concern overblown. Over a 5-year construction programme, the cumulative effect of many such micro-pressures is that the contractor’s QC sets aside one defect after another, each one individually defensible.
The Owner’s Engineer reports to the project owner. The owner’s compensation is measured against final project performance, not against intermediate schedule milestones. The owner has a structural incentive to back the Owner’s Engineer’s defect calls, because the cost of premature failure exceeds the cost of investigation by a factor of 100 or more. Across PCCI leadership’s experience on landmark dam programmes including Tala HEP (1,020 MW), Bhutan, Mangdechhu HEP (720 MW), Bhutan, and Punatsangchhu-1 HEP (1,200 MW), Bhutan, the most consequential decisions were not the ones that required complex analysis. They were the ones that required holding the line under schedule pressure on a defect the contractor’s QC was prepared to accept.
The Owner’s Engineer also brings the cross-project pattern recognition that no single contractor’s QC team has. The drift in fly-ash silicon dioxide content from 64 percent to 56 percent over a quarter looks normal on a single project. Across five projects, the experienced Owner’s Engineer recognises it as a signal that the source thermal power station has changed coal supply, and that the calorimetry test must be repeated. The contractor’s QC team, by definition, sees only one project. The Owner’s Engineer sees the pattern.
Designing the Owner’s Engineer workflow to catch these 12 defects
The 12 defects above are not caught by any single magic procedure. They are caught by a workflow with four layers:
Pre-construction. Specification review, mix design verification, batching plant audit, on-site laboratory accreditation check, calibration audit of every instrument, supplier qualification. The Owner’s Engineer audits each item against the project specification and flags gaps before the first placement.
Daily site presence. A walk that covers the stockpiles, batching plant, transport, placement face, vibration, and curing in sequence. The walk is the same every day. The discipline is that the same eyes see the same things at the same time intervals, and notice when anything is different. The walk takes 90 to 120 minutes per shift. It is the foundation of catching defects 2, 4, 5, 6, 8, and 11.
Scheduled test data audit. Weekly review of all aggregate gradation, cement test certificates, fly-ash test certificates, fresh-concrete and hardened-concrete test results, against trend charts. The data is plotted, not just filed. Drift is visible only on a chart. This catches defects 1, 3, 7, 10, and 12.
Structured NCR escalation. Every non-conformance is logged, root-caused, and closed out with documented evidence. The Owner’s Engineer reviews every NCR independently and tests samples to verify the contractor’s lab is calibrated. NCRs that recur in the same category trigger a root-cause review with the contractor’s quality manager. This catches the institutional and systemic defects that single-NCR thinking misses. The architecture of this workflow is laid out in our 15-section Concrete QA/QC Plan reference.
This is not heroic engineering. It is consistent engineering. It is what the Owner’s Engineer service at PCCI is built to deliver, drawing on leadership experience across 4,000+ MW of hydroelectric concrete placement and on the QA/QC system framework refined across every project from Tala to Punatsangchhu-1. Each of the 12 defects has been caught, documented, and corrected on a live dam site at some point in the last four decades. The catalogue is not theoretical.
The compounding effect of catching defects early
A single defect, caught at the placement stage, is corrected at the cost of an hour of delay and perhaps a few cubic metres of replaced concrete. The same defect, caught after the lift has cured, becomes a structural repair: epoxy injection, grouting, anchor pinning, or in extreme cases full-depth replacement. The repair cost is 10 to 100 times the prevention cost.
The same defect, missed entirely, becomes a service-life issue that surfaces 20 to 50 years after commissioning, when the dam owner has long forgotten which lift was which and the design engineers have retired. By then, the cost of remediation is not a function of the original defect. It is a function of the cumulative downstream consequences: lost generation, dam-safety review, reservoir restrictions, and in extreme cases reconstruction. The DRIP programme in India, which has rehabilitated 223 dams at a cost of Rs 2,567 crore under DRIP-1 alone, is in part the bill for defects that an Owner’s Engineer at construction would have caught for a fraction of the rehabilitation cost (PIB: Dam Rehabilitation and Improvement Project).
This is the case for an Owner’s Engineer on every hydropower dam programme. Not as an additional cost line item. As a structural risk-reduction investment that compounds across the asset’s 100-year design life.
If your hydropower project is moving toward concrete placement on a dam, intake, powerhouse, or spillway, the cheapest insurance against the 12 defects above is to bring in an independent technical authority before the first cubic metre is placed. The conversation begins with the project specification, the contractor’s QC plan, and a walk-through of the batching plant. From there, the Owner’s Engineer workflow does the rest.
To discuss your project, see PCCI’s Independent Review and Owner’s Engineer service, or contact our office to schedule a technical conversation.